Identity and Access


Cygna Auditor can now forward events to SIEM systems in a standard syslog format or in a structured view to Splunk. Cygna Auditor events are presented in plain language which greatly simplifies the understanding and consumption of the audit information. This enables operational and security teams to work efficiently and make decisions and react quickly.
The structured view for Splunk normalizes the audit data in the SIEM views by the Detail (expandable list of the modification), Item (object/attribute that was changed), Source (system or platform of modification), Success (if the action succeeded or failed), What (the object/attribute that was changed) When (timestamp), Where (the system where the change was applied), Who (account that made the change).
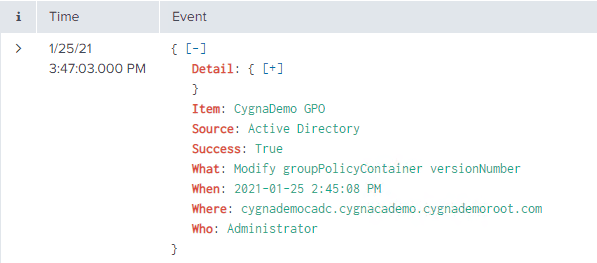
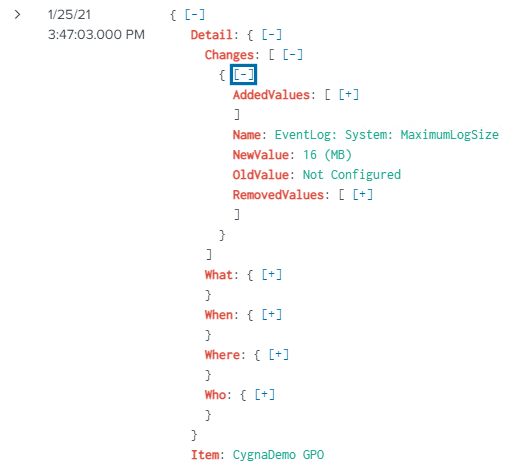
In the following example, the expandable Detail node provides the GPO setting that was modified with both the old and new values.
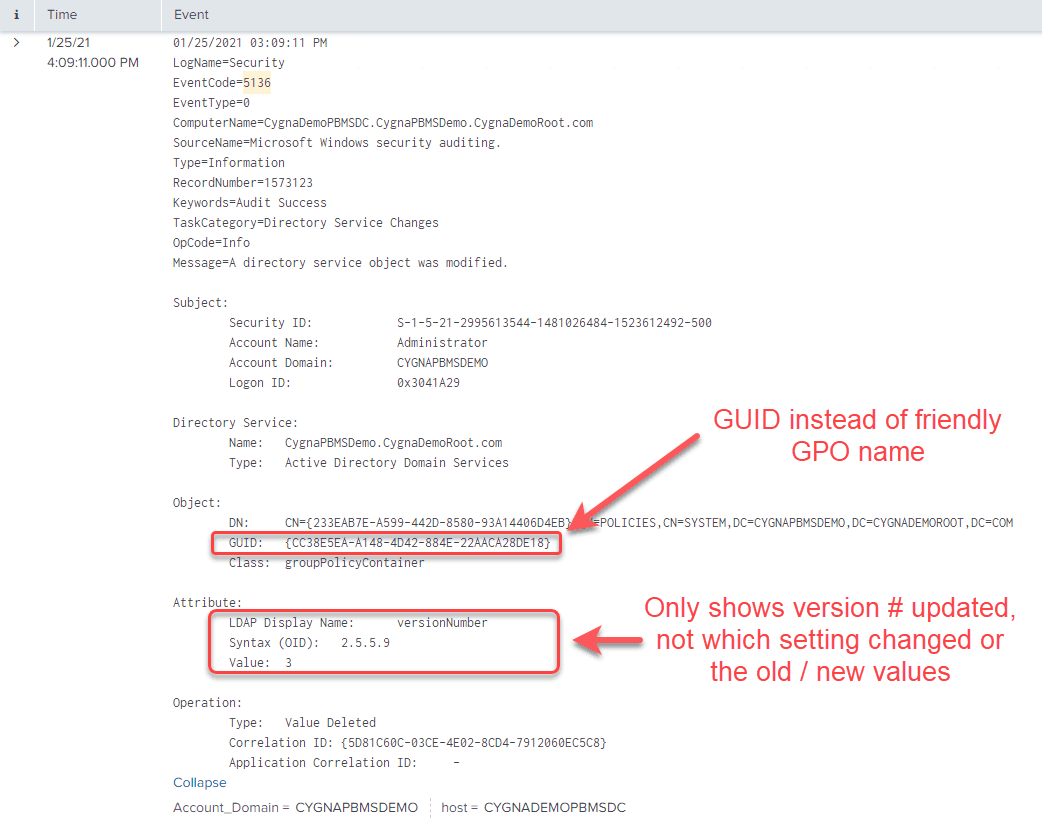
The following is a native GPO change event imported into a SIEM from the Windows Event Logs. There is a substantial amount of text to sift through to try to understand what has occurred. Since the friendly name of the GPO is not shown you would either have to know the GUID or do a search to find out which GPO was modified. This also does not show you what has changed. You would need to have a previously exported GPO report prior to the change and manually compare the settings with the current version. Needless to say, this would be a very time-consuming task.
Cygna Auditor provides SIEM systems a data translation layer service that converts non-human readable raw log data into plain language values as they occur.
To send Cygna structured events to Splunk you will need to configure an HTTP Event Collector. For more information on this topic please select the following Splunk documentation link or see the following example configuration.
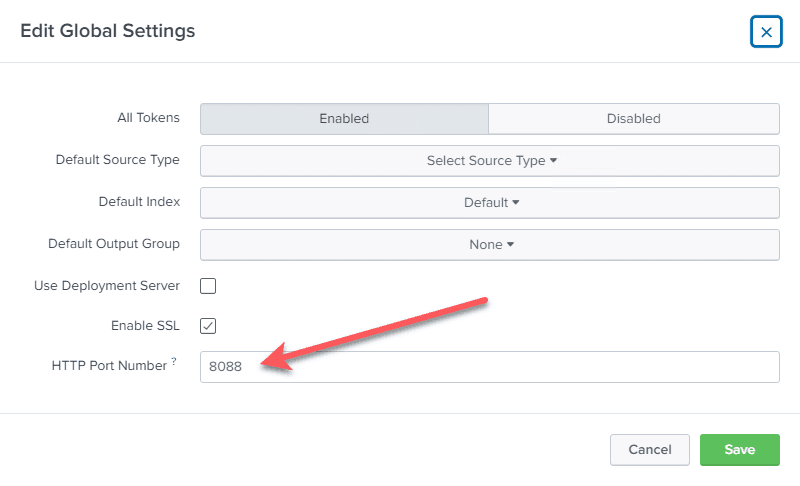
The first thing you need to ensure the HTTP event collector is enabled in Splunk UI through:
Settings -> Data Inputs
HTTP Event Collector
Global Settings
Make sure it is enabled and make note of the port #.
The second step is to create an Event Collector token:
Settings -> Add Data
Monitor
HTTP Event Collector
For the Source Type under Input Settings step, make sure you pick Select and then in the Select Source Type dropdown pick Structured _json
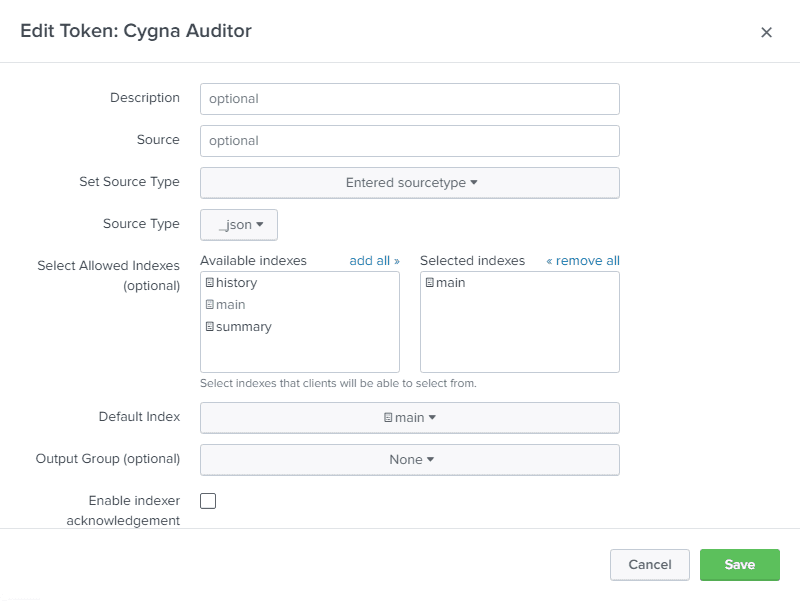
Once the configuration is saved you will see a token value that will be required to configure the connection to Splunk from the Cygna server.

Enable Remote Logging
From the Cygna Server UI:
Configuration -> System
Select Remote Logging tab in the System Configuration window
Change the type drop down to Splunk
Enter the URL for the Splunk HTTP Collector with port#
Enter the Splunk HTTP Event Collector Token Value
Ensure the message format is set to JSON
Save the configuration
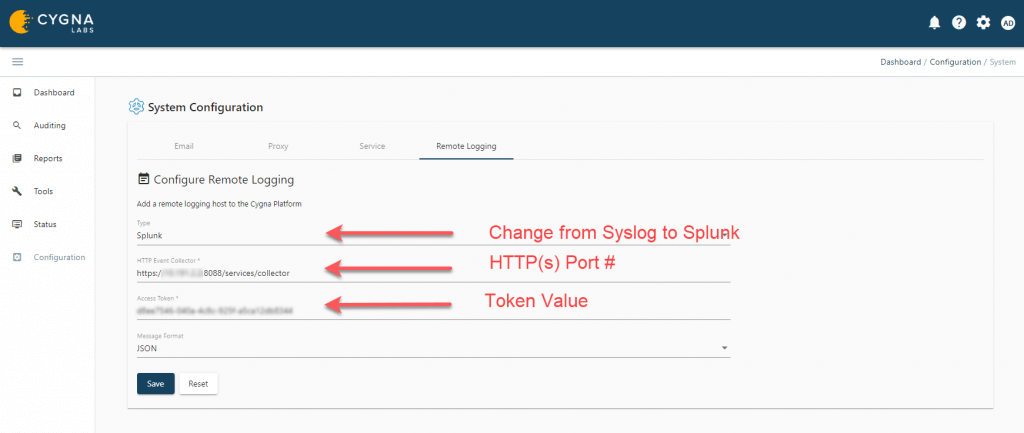
Once both Cygna and Splunk have been configured to be able to send and receive events you can decide what events you want to send. This is done through alert remote logging on the Cygna server.
Cygna events can be forwarded to SIEM systems through the alerting feature in Cygna reports. The alerts events can be sent via email notification or through remote logging to SIEM systems or both.
From the Cygna Server UI:
Reports
Alert settings
(a) For existing reports, select its menu icon (hamburger) and then Alerts and enable the toggle
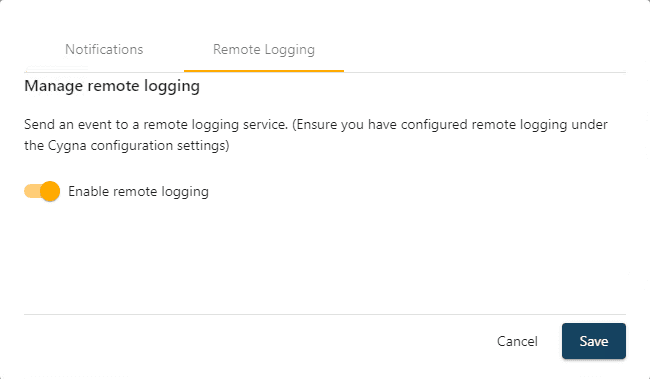
(b) When creating a new report under the Manage alert settings tab choose Remote Logging and enable the toggle
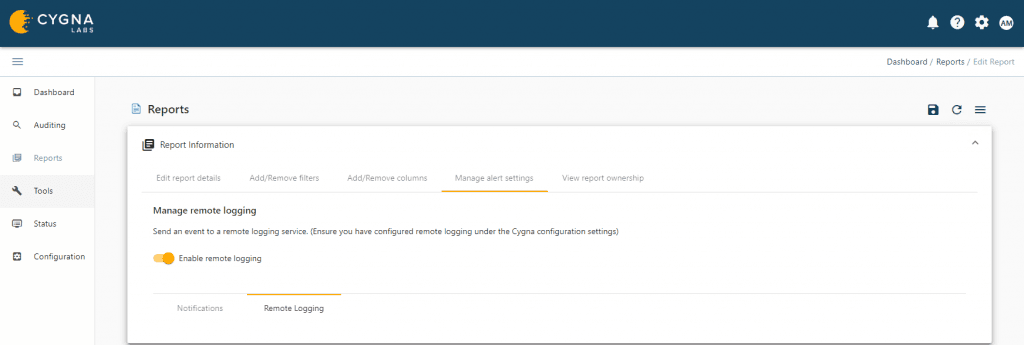
Once the alert is saved any event matching the filtering criteria will be sent to the SIEM system defined in the Cygna Remote Logging configuration.
Our experienced engineers will fine-tune the demo based on your specific needs. You’ll find out how easy it can be to secure your sensitive data.
